Fibonacci fSeries

The possibilities are endless.

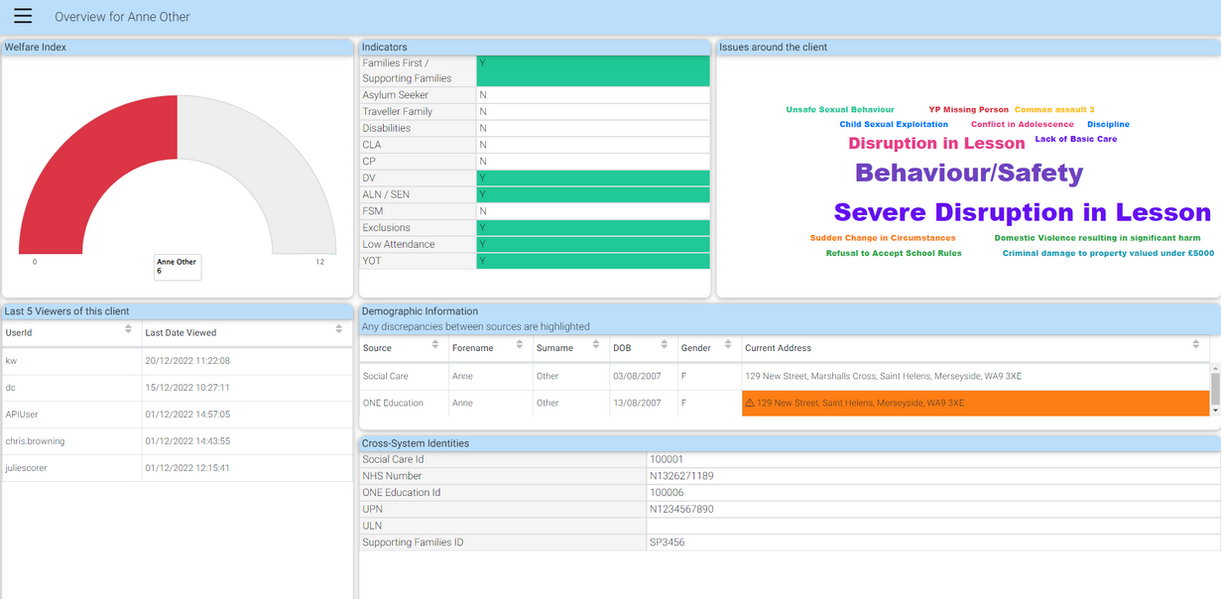
fSeries is a comprehensive tool for gathering data from across multiple sources and bringing together as dashboard and document outputs.

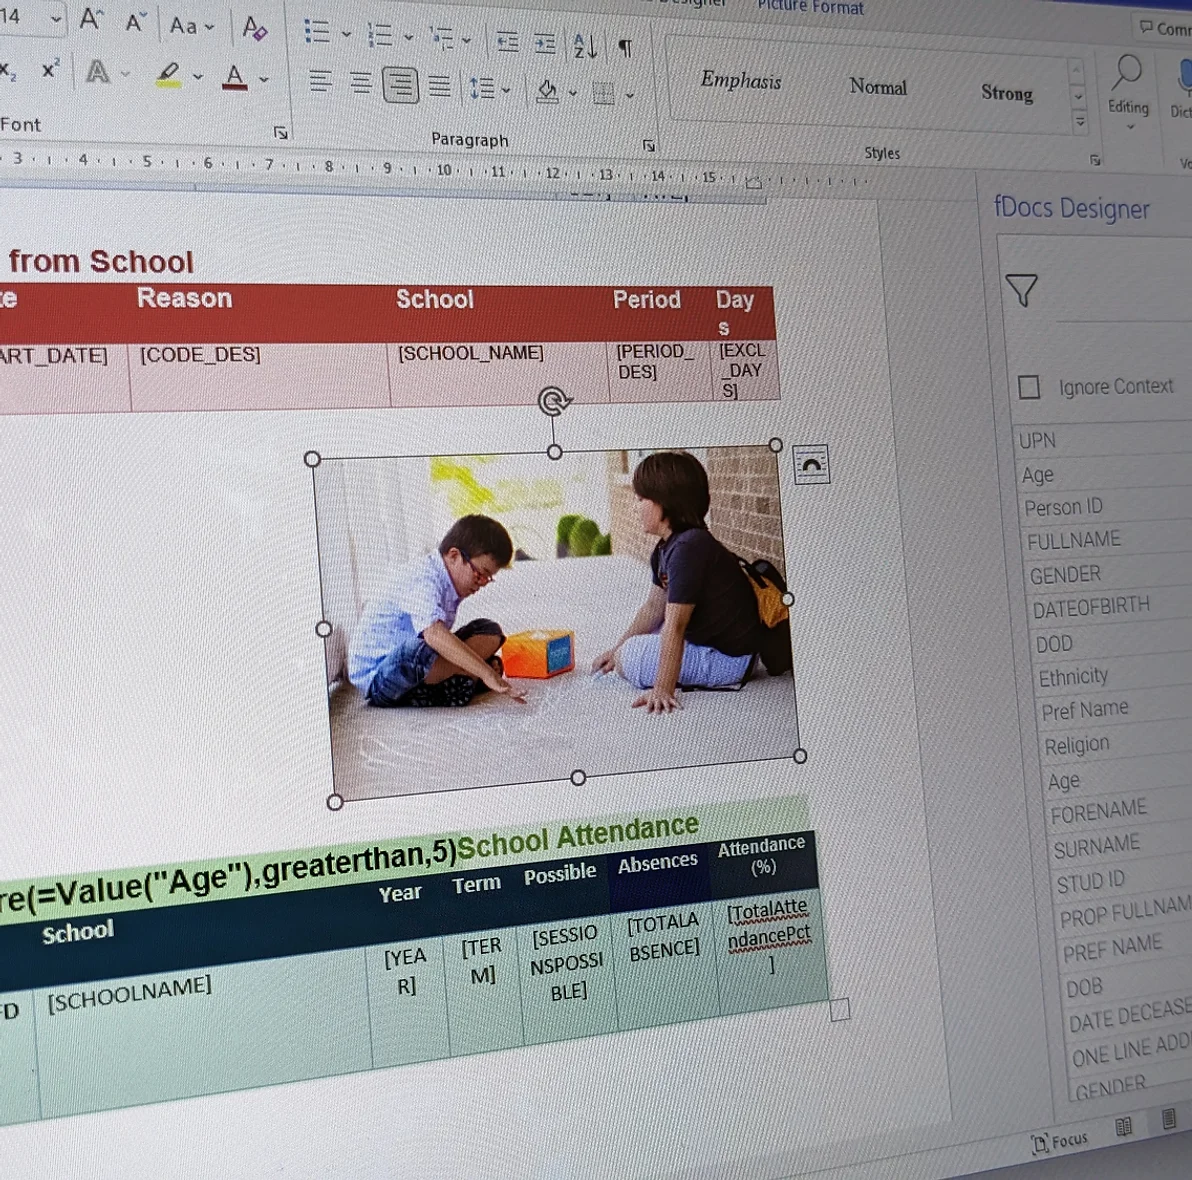
It's a non-coding product that makes it easy to gather data from wherever it is in your organisation and get it in front of those who need it.

But data is sensitive, and fSeries has a vast array of methods of securing your data from documents level to induvial field, and from teams and roles to individual users. 

fSeries will also audit your users’ data access, even recording search criteria used, if you wish. 

Notify users of exceptions or situations they need to made aware of, by email or on their fSeries menu. This can be a fully automated facility if you wish. 

Share data and documents (under strict security) with other systems through the fSeries API option. Design your own RESTful API and control who can see what. 

Network together multiple fSeries systems for simple exchange of data and documents (with detailed security). 

men and women having a meeting

Audit user access to data, even searches made.

Powerful options to manage how and what you record of user's activity.

Use fSeries outputs to report on audits by user and/or data accessed.

Comprehensive dashboards pulling together data from multiple sources.

Highlight exceptions based on easy-to-create tests.

Present data in many different ways, including interactive maps. 

Comprehensive dashboards make it easier to understand your data. 

Get a full and comprehensive picture of the subject.

Textual highlighting can be enabled, based on simple rules. 

Discover relationships in your data, brought together from many sources. 

Show geographical data with height and colour grading, to add dimensions to the presentation.

Filter data interactively within the dashboard. 

Having created a number of dashboards and documents, create side and top navigation menus to your presentations and documents to guide users through their data.

Restrict menu options by user role and/or data attributes.

Add web links to external applications, optionally passing through any data gathered using fSeries.

a group of cubes that are on a black surface

fData

Gather and manipulate data on the fly.

At the heart of fSeries is its ability to gather data. The way in which generated documents and online dashboards work is to request a set of data from fData about a specific subject. It might be a person, a family, an address, a team. The important thing is that fData is not providing open access to data but instead it gathers a set of data for a purpose.

The data that is gathered, and the places it’s gathered from are up to you. The fData design tool lets you select the data you want for a set of data (called a Data Set Definition, DSD) without coding and mostly just selecting from options and lists.

Once you have set up a DSD, it can be used to create documents and dashboards.

Where your data comes from is up to you. It’s likely you will have a number of different databases and systems where useful information is kept. Provided there is some means of accessing a data source, fData can be used to get data from it for the set of data you are gathering.

In many cases it will be by using database queries, or by connecting to an API. In others fSeries may already have a plugin that connects to the system’s application programme interface (API) or web service. If not, it’s a relatively simple job to create a plugin for it.

fPanels

Show and visualise through Dashboards

fPanels visualises data from fData on-screen, both desktop and tablet. Dashboards are interactive with comprehensive content in a single page, drill-down to further data, links to other presentations and links to documents.

The content and layout of a dashboard are up to you, created using a non-technical design tool that lets you see how your dashboard will look as you build and design it.

Show data in a record or grid layout, in one of dozens of different chart types, geo-locate information on a map, sort information, quickly export it to CSV, highlight important data - it's all here.

fDocs

Print quality outputs

The same information that is gathered using fData for a dashboard can also be used to present quality output documents in the layout you need.

Our template editor plug-in for Microsoft Word means your template can include any style and content that Word allows, including images and charts.

To create a document template you just select the the data set (e.g. chronology or family details). Word then shows a list of all of the data available to be included. fDocs organises this in a way that makes it easy to find the data you need and to guide you by only offering data groups (tables) and fields that are relevant to your place in the document.

The skills required to design an fDocs template are those that you use to create a Word document. This means that the document designer can focus on the template instead of the data.

Not only that, but powerful features allow you to conditionally turn on or off parts of your document depending on the data. Hide a word, sentence, paragraph or entire section in real-time.

Then, allow the user to generate an output in PDF, or many other output formats - including Excel.